Leveraging NetApp Reporting Tools for Proactive Capacity and Compliance Management

When you notice a slow system, you think something is broken. That is not always true. Sometimes, it just needed to be watched closely enough.
That could be the case with storage performance and compliance issues. Obvious signs, such as unused volumes piling up, thresholds quietly crossed, or a policy that no one noticed had drifted, are often missed.
In such situations, you don’t need more dashboards; you need smarter solutions that tell you before something goes wrong.
Let’s discuss NetApp reporting to help you do just that.
Understand the gaps in native monitoring
Most teams stick with what ships out of the box: basic alerts, default thresholds, and a few static charts. But that’s not enough.
NetApp’s tools cover the surface well. But problems don’t always show up on the surface.
Capacity reports might tell you that a volume is 80% full. But they won’t always tell you how fast that’s happening. Or whether five other volumes on the same aggregate are also filling up.
Compliance is even trickier. You’ve got to keep things the way policies expect. One change in a snapshot policy, one missed encryption setting—those small drifts don’t trigger native alerts, but they can snowball.
That’s where the real work starts – finding what’s missing.
Setting up predictive capacity thresholds
People set the threshold at 80% or 90% and let the system scream when full. But that’s not proactive; it is a fire alarm.
Instead, you should use trends. If a volume grows 5% every week, you don’t need to wait; you can predict when it will hit 95%. That’s your signal.
The NetApp monitoring tool should let you set alerts based on the growth rate, not just static numbers.
Also, not all thresholds fit all volumes. Tag volumes by type. Apply rules that match their role. That’s how you stop noise and start seeing risk more clearly.
Mapping compliance metrics to storage behavior
Compliance is legal, and it’s structural. Storage teams think compliance is someone else’s job. It’s not. Things like encryption, snapshot retention, and data locality are all tied to how storage behaves.
So, what can NetApp reporting tools track here?
- Snapshot schedules that don’t follow the set policy
- Volumes created without encryption
- Data moved outside its allowed region
Use tools that report settings and compare them to expected values. If something changes, it should show up, quietly or loudly, depending on the impact.
Aligning NetApp Active IQ and OnCommand Insight for strategic visibility
There isn’t one single pane of glass. But combining the right ones will give you a clear view.
Active IQ helps you see risks early. It uses telemetry from thousands of systems. If something in your environment matches a known pattern, it flags it. Simple. But Active IQ won’t dig deep into workload behaviors or custom compliance needs.
That’s where OnCommand Insight (OCI) comes in. It tracks usage, performance, and violations across multiple vendors, too. So, if you’re using NetApp in a mixed environment, OCI becomes your map.
Together, they do something better; they provide context. Active IQ tells you what might go wrong, and OCI tells you where and why.
Using both gives your NetApp monitoring tool more muscle and better timing.
Automating compliance snapshots and reports
Manual reports get forgotten, skipped, or done once a quarter. So, automate them.
NetApp tools like OCI let you schedule reports. You can set filters so that only non-compliant resources show up. You don’t need to scroll pages of healthy data—just the gaps.
Give each team access only to what they need. Security shouldn’t have to look at storage graphs, and finance doesn’t need IOPS.
Also, version your reports so that when an audit asks for history, you don’t scramble—you already have it.
Custom reporting with OCI DWH and API integration
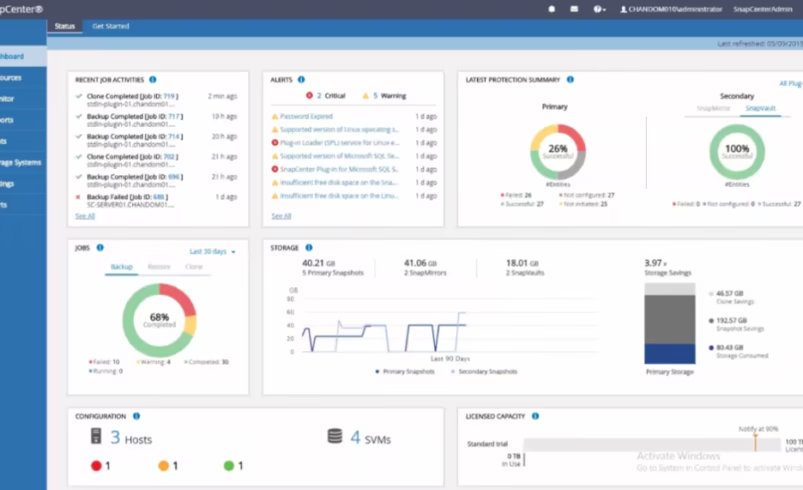
Sometimes, you want more than what’s offered. OCI has a data warehouse backend. It stores long-term data. You can query it, build your dashboards, and plug it into tools like Power BI or Tableau.
Want a 6-month trend on backup failures across only Tier-1 volumes? You can do that.
Do you need to blend NetApp storage data with VM-level stats from any other tool? Use the API to pull the data, combine it, and automate it. This is where teams move from reporting to actual analytics.
Conclusion
NetApp gives you a lot of tools. But tools don’t fix problems. The way you use them does.
Capacity and compliance aren’t things to watch periodically. They’re things to shape and steer before they become issues.
Set smarter thresholds. Track behavior, not just numbers. Build custom views that speak to each team. And keep the noise low so that real problems stand out.
That’s how NetApp reporting becomes more than just reporting. It becomes foresight.


